

On this page
Reorder and stock analysis
The Reorder list grouped by supplier and sent on WhatsApp, and the five views of Analytics, Stock, with how each figure is worked out.
10 minute read
Two screens, two jobs
Stock, then Reorder, is a list to act on: what to buy today, and from whom. Analytics, then Stock, is for reading: which items carry the business, what has sat too long, and what things really cost. Both carry the mark From your Tally books: they are worked out from your books and change nothing in them.
Reorder is open to everyone who can see stock. Analytics, Stock needs See figures and reports, so a Stock keeper has the first and not the second. See Users and roles.
Reorder
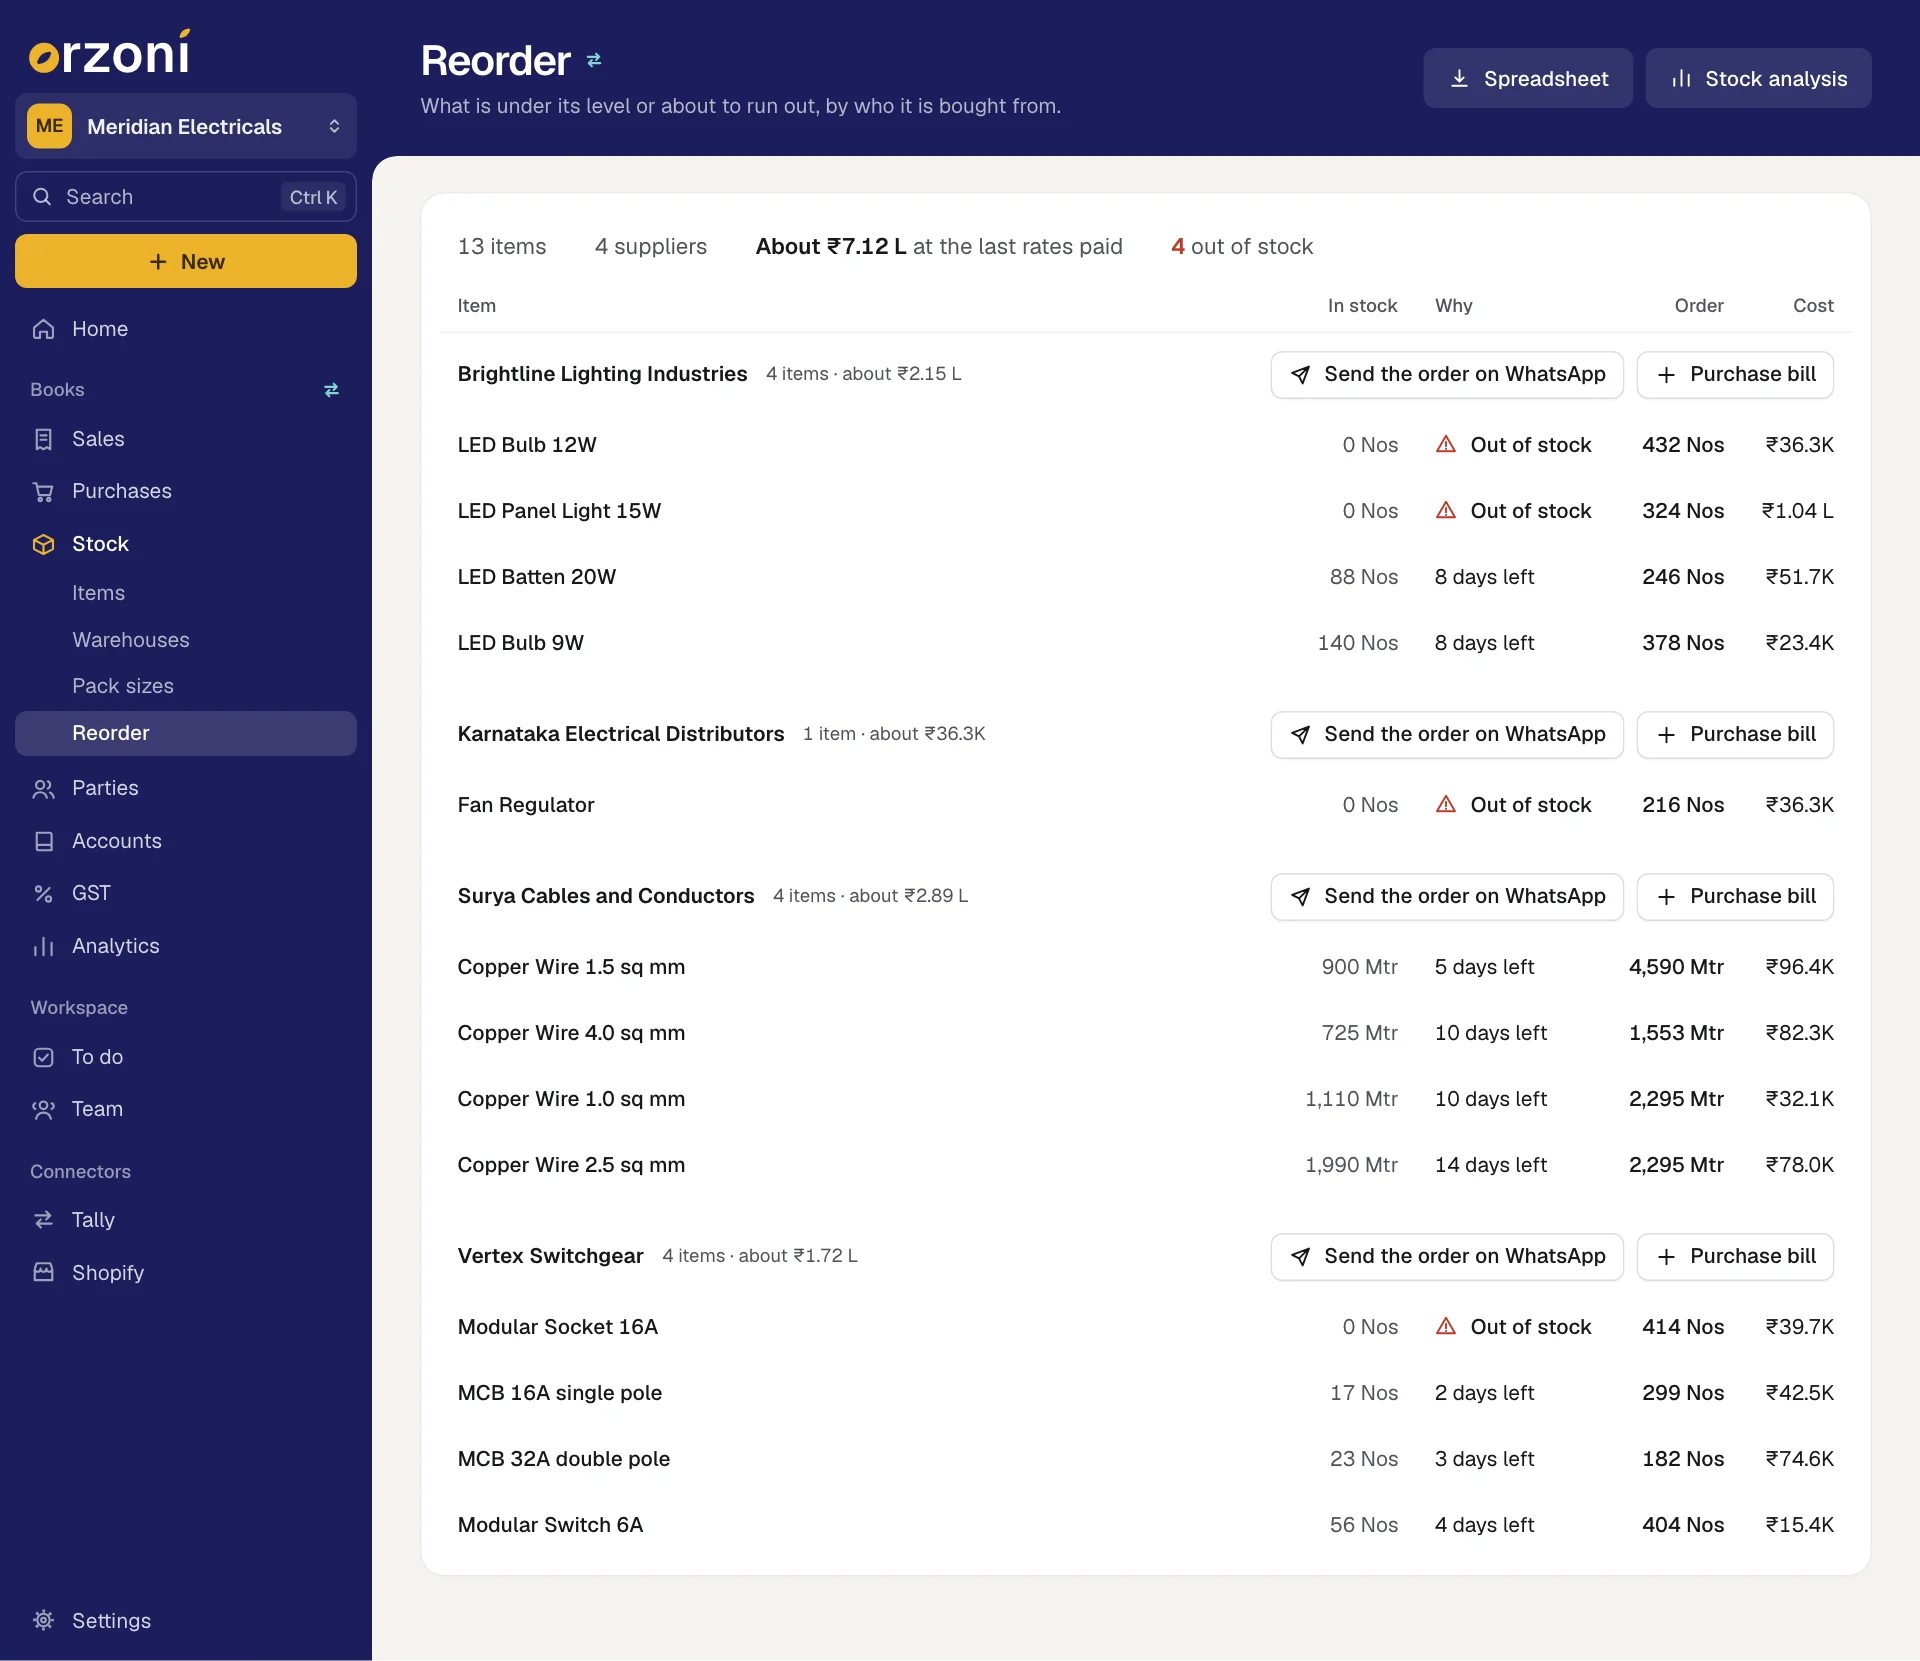
The list is as things stand today, so it has no dates to choose. Its first line says what it comes to: how many items, from how many suppliers, about what it will cost at the last rates paid, and how many of the items are already out of stock.
Which items are listed
An item is listed when its stock is at or under the Reorder at level you set on its page.
With no level set, it is listed when under 15 days of stock are left at the rate it sold over the last 60 days. If your books are younger than 60 days, the rate is taken over as many days as they hold.
Items with no unit, and items you have hidden, are left off.
What each row says
The list is divided by supplier. Each supplier heads rows of its own, with how many items that is and about what they cost, and two buttons: Send the order on WhatsApp and Purchase bill.
| Column | Shows |
|---|---|
| Item | Press the row to open the item |
| In stock | What is left today |
| Why | Under 50 Nos when it is at or under its level, 7 days left when it is about to run out, or Out of stock |
| Order | How much to order |
| Cost | The order at the last rate you paid. Where there is no quantity to order, the last rate for one |
The supplier is the one under Usually bought from on the item's page. With none set, it is the supplier the item was last bought from. Items with neither are at the end, under No supplier known, which has no buttons. Within a supplier, the items with the fewest days left come first.
How much to order is worked out in this order:
- The Order this many you set on the item's page.
- With none set, enough for 30 days at the rate it sells, less what is in stock.
- For an item with a level and no recent sales, enough to bring it back up to twice its level.
Set a level for an item
- Open the item, from this list or from Items.
- On the Reorder card, fill in Reorder at and, if you want a fixed quantity, Order this many.
- Under Usually bought from, choose a supplier. The list offers your suppliers in Tally, and the supplier must be one of them.
Press Save.
Orzoni says Saved. The Reorder list follows at once.
These are kept in Orzoni and never sent to Tally. Clear a box and save to go back to the rule of 15 days. See Items.
Send the order
Beside the supplier's name press Send the order on WhatsApp.
A sheet opens headed Order from and the supplier's name.
- Check the WhatsApp number. It is the supplier's phone number from Tally when there is one. Leave it empty to choose the chat in WhatsApp.
- Read the Message. It names your business, lists each item with its quantity, and asks the supplier to confirm the rate and when the goods will reach you. You can change the words.
- Press Open WhatsApp. It opens in your own WhatsApp, and you press send there. Copy the message puts the words on the clipboard instead.
When the goods arrive, Purchase bill beside the same supplier opens a new purchase bill with that supplier chosen. You enter the items as they are on the supplier's bill: see Purchases, notes and other entries.
Spreadsheet, on a wide screen, saves the whole list as a CSV file, one row for each item with its supplier, stock, level, order and last rate. Alt E does the same.
When no item is due, the screen says Nothing to reorder. Set a level on an item's page to be told sooner.
Analytics, Stock
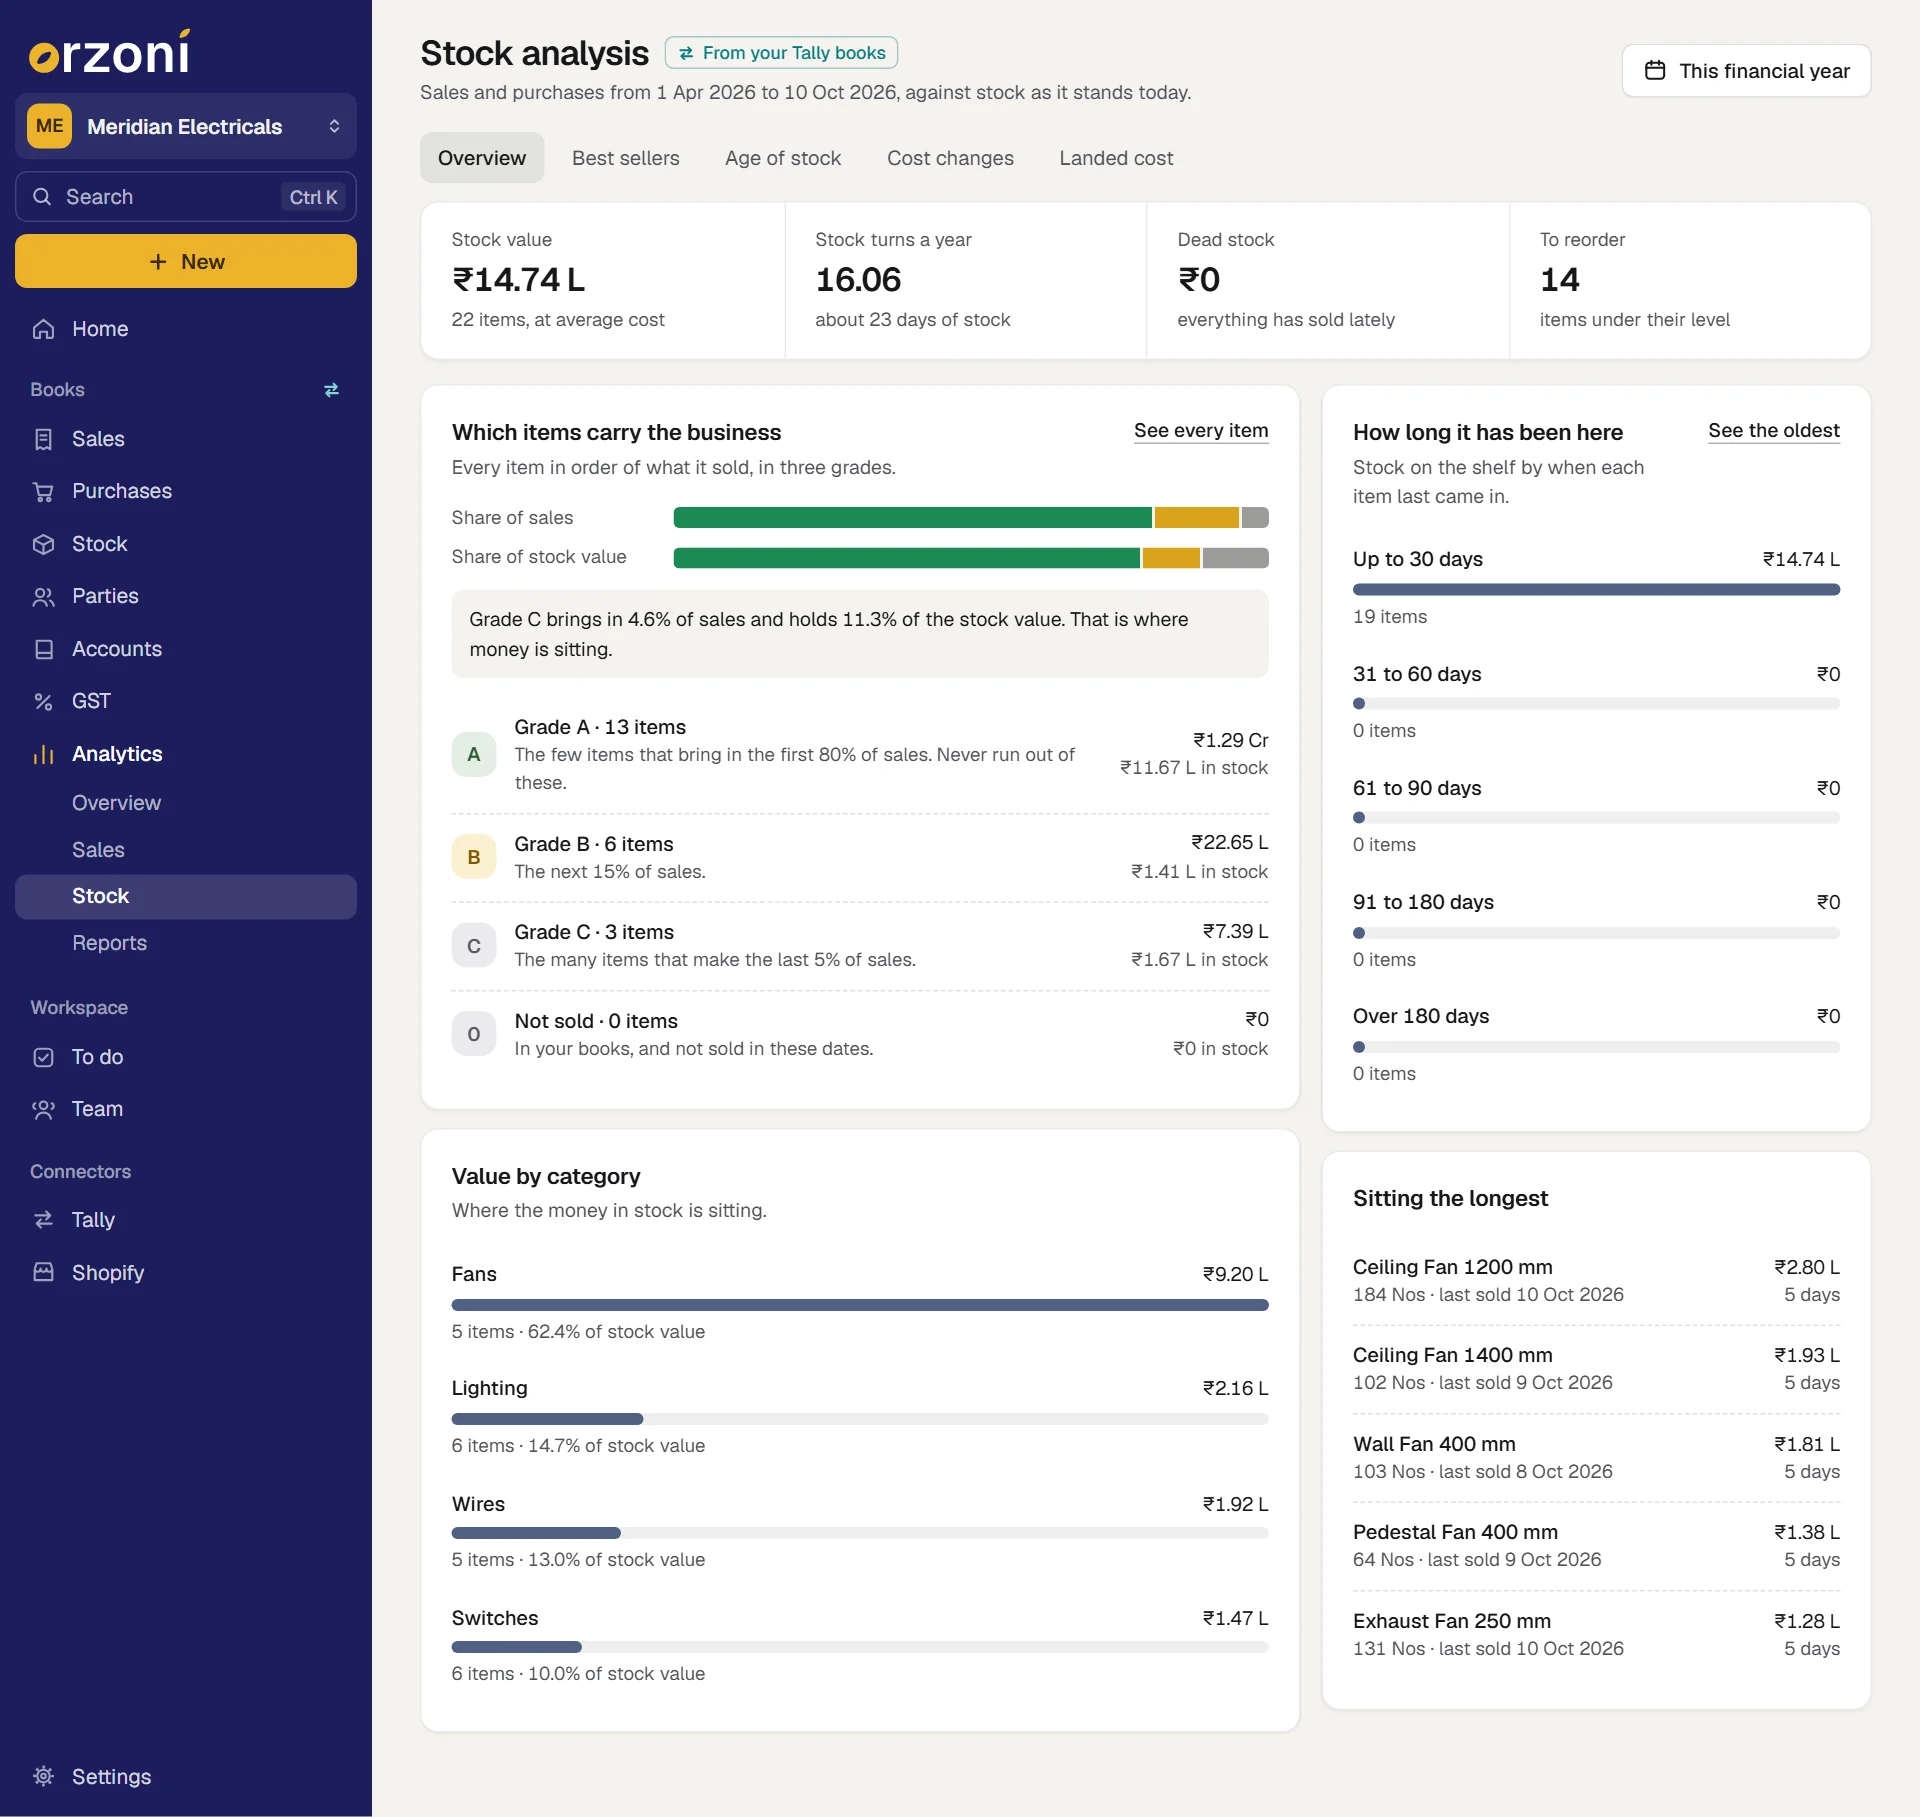
The screen is headed Stock analysis. On a phone it is under More, then Analytics, then Stock in the row of names at the top.
Choose the dates with the button at the top right, or press F2. Sales and purchases are taken from those dates, and set against stock as it stands today. The line under the heading says which dates are on show.
There are five views: Overview, Best sellers, Age of stock, Cost changes and Landed cost. In every table, press a row to open the item. On Best sellers, Age of stock, Cost changes and Landed cost, Spreadsheet saves the table as a CSV file, and Alt E does the same.
Overview
Press any of the four figures to open the screen behind it.
| Figure | How it is worked out | It opens |
|---|---|---|
| Stock value | What your stock is worth today, with how many items you have | Items |
| Stock turns a year | The cost of what you sold in the dates, carried to a full year at that pace, divided by the stock value. Under it, the days of stock that makes: the stock value divided by the cost sold in a day, or the words "nothing sold in these dates". The figure reads Not known when there is no stock to measure against | Best sellers |
| Dead stock | The value of items on the shelf that have not sold for 90 days, with how many items that is | Age of stock |
| To reorder | How many items are on the Reorder list | Reorder |
- Which items carry the business. Two bars compare each grade's share of sales with its share of stock value. Under them, each grade has its number of items, its sales, and what it holds in stock, with a last row, Not sold, for items that sold nothing in the dates. Where a grade other than A holds a much larger share of the stock than it brings in sales, a line says so and ends That is where money is sitting.
- Stock below zero appears when an item's stock is negative, and lists up to ten of them. A purchase is usually missing or entered late.
- Value by category shows where the money in stock is sitting, by stock group, with each group's share of the stock value.
- How long it has been here sorts stock by when each item last came in: Up to 30 days, 31 to 60 days, 61 to 90 days, 91 to 180 days and Over 180 days.
- Sitting the longest lists the five items that came in longest ago.
Best sellers
Every item that sold in the dates, largest first, in three grades.
| Grade | Which items |
|---|---|
| Grade A | The few items that bring in the first 80% of sales. Never run out of these |
| Grade B | The next 15% of sales |
| Grade C | The many items that make the last 5% of sales |
Items are taken in order of what they sold, and the sales are added up as the list goes down. An item is graded by where it starts in that running total, so the one that crosses the 80% line is still Grade A.
Choose All, Grade A, Grade B or Grade C, or search by item or category. The table shows the grade, sales, share of sales, quantity sold, stock and stock value. The line above it gives the sales in the dates, and how many items in stock sold nothing. The list holds the 300 items that sold the most.
Age of stock
Dead stock lists what is on the shelf and has not sold for 90 days or more, or has never sold, with the largest value first. It holds up to 200 items.
| Column | Shows |
|---|---|
| In stock | The quantity on the shelf |
| Value | What it is worth |
| On the shelf | Days since the item last came in |
| Last sold | The date, or Never |
Beside it, By age has the same age bands as the Overview, and Sitting the longest lists twelve items with when each came in and when it last sold.
Age is counted from the last time the item came in, by a purchase, a receipt note or a stock journal. For an item that has only its opening stock, it is counted from the start of your books.
Cost changes
What you pay for each item, then and now. Only items bought in the dates are counted.
| Column | How it is worked out |
|---|---|
| Was | The rate at the last purchase before the dates chosen. If there was none, the first purchase in them |
| Now | The rate at the latest purchase in the dates |
| Change | How far Now is from Was, as a percentage |
| Margin was and Margin now | The item's last selling rate less the buying rate, as a share of the selling rate |
| Effect | What you paid for everything bought in the dates, less what it would have cost at the Was rate. It is what the change has cost you, or saved you |
Under each item's name are the supplier of the latest purchase and how many purchases there were in the dates.
Only items whose rate moved by half a percent or more are listed, with the largest effect first. The four figures above the table are:
- Cost more now and Cost less now: how many items moved each way, out of those bought, and how many are unchanged.
- Extra paid or Saved: the effects added up, against buying it all at the old rates.
- Margin squeezed: items that cost more now and whose margin is under 10% at what they sell for.
Landed cost
What each item costs by the time it is on your shelf: the rate on the purchase bill, plus its share of freight, packing and the other costs of getting it in.
The four figures are Goods bought in the dates, the Cost of getting it in, what that has Added to cost as a percentage on top of the purchase rate, and the switch Count GST as a cost. The table sets each item's Bill rate beside its Landed rate, with the percentage Added.
- Costs entered on the purchase bill itself in Tally, such as a freight ledger, are read from Tally and shared across the bill's items by value.
- Count GST as a cost is off to begin with, because a registered business claims GST back. Switch it on if you cannot claim it.
To add a cost that came on a separate bill, such as a transporter's bill or customs duty:
Under Purchase bills, press the bill the cost belongs to. The latest 40 in the dates are listed. Choose shorter dates to reach older ones.
A sheet opens with the bill's lines, and what it took to get them here.
- Under Add a cost, enter what it was For, such as Freight, and the Amount.
- Choose how to Share it across the items: by value, where dearer items carry more, or by quantity, where each unit carries the same.
Press Add to this bill.
Orzoni says Cost added, and the bill carries a mark such as 1 added.
Remove, beside a cost you added, takes it off again. A bill can have up to 12 added costs. Open the bill itself leads to the entry.
How the figures are worked out
- Stock value of an item is Tally's own closing value for it.
- Average cost follows Tally's average cost method: the value the item started with and everything brought in since, divided by the quantity it started with and everything brought in since. Brought in means bought on a purchase bill, received on a receipt note, or made or moved in by a stock journal.
- A warehouse's value, and the value on Pack sizes, are the quantity times that average cost. If your company values stock another way in Tally, such as first in first out, these can differ from the stock value on Items. Data health compares Orzoni's working with Tally's, item by item.
- Days of stock left uses the last 60 days of sales, or as many days as your books hold.
- Running low means at or under the level you set, or under 15 days of stock when no level is set. Dead stock means not sold for 90 days. These two thresholds are fixed.
- For figures these screens do not have, build a report: see Reports.
What next
- Items: set an item's reorder level and its usual supplier.
- Purchases, notes and other entries: enter the supplier's bill when the goods arrive.
- Warehouses and pack sizes: where the stock is, and moving it.
- Analytics: the other pages of figures.
- Reports: a table of your own.
Still stuck? Write to support@orzoni.com and say which step you are on, or book a walk-through call.