

On this page
Analytics
Your figures as pages of tiles. What every tile on Overview, Sales, Repeat buyers and Workspace shows, how repeat buyers are worked out, what the colours mean, how the dates work, and how to arrange each page your own way.
16 minute read
Pages of tiles
Analytics in the rail has four lines: Overview, Sales, Stock and Reports. Overview and Sales open the same board. The board has pages, and each page is a grid of tiles: a figure, a chart or a list. Four pages are there to begin with.
| Page | What it is for |
|---|---|
| Overview | The business at a glance, with the tiles of Tally's own dashboard |
| Sales | What was sold, of what, to whom and where |
| Repeat buyers | Which customers came back, month after month |
| Workspace | The team, the tasks and the money being followed up |
- Press a page's name above the tiles to open it.
- With the keyboard on a page's name, Left and Right turn to the page beside it.
- On a phone, draw a finger across the screen to turn the page. The dots under the tiles show which page you are on.
- Repeat buyers and Workspace are not in the rail. Reach them from the names above the tiles, or type
repeatin Search and choose Analytics: Repeat buyers.
The other two lines of the rail have guides of their own: Stock is stock analysis, and Reports is Reports.
Everything here is worked out from your Tally books, and the mark beside the title says so: From your Tally books. Nothing you do on these pages changes anything in Tally.
Overview
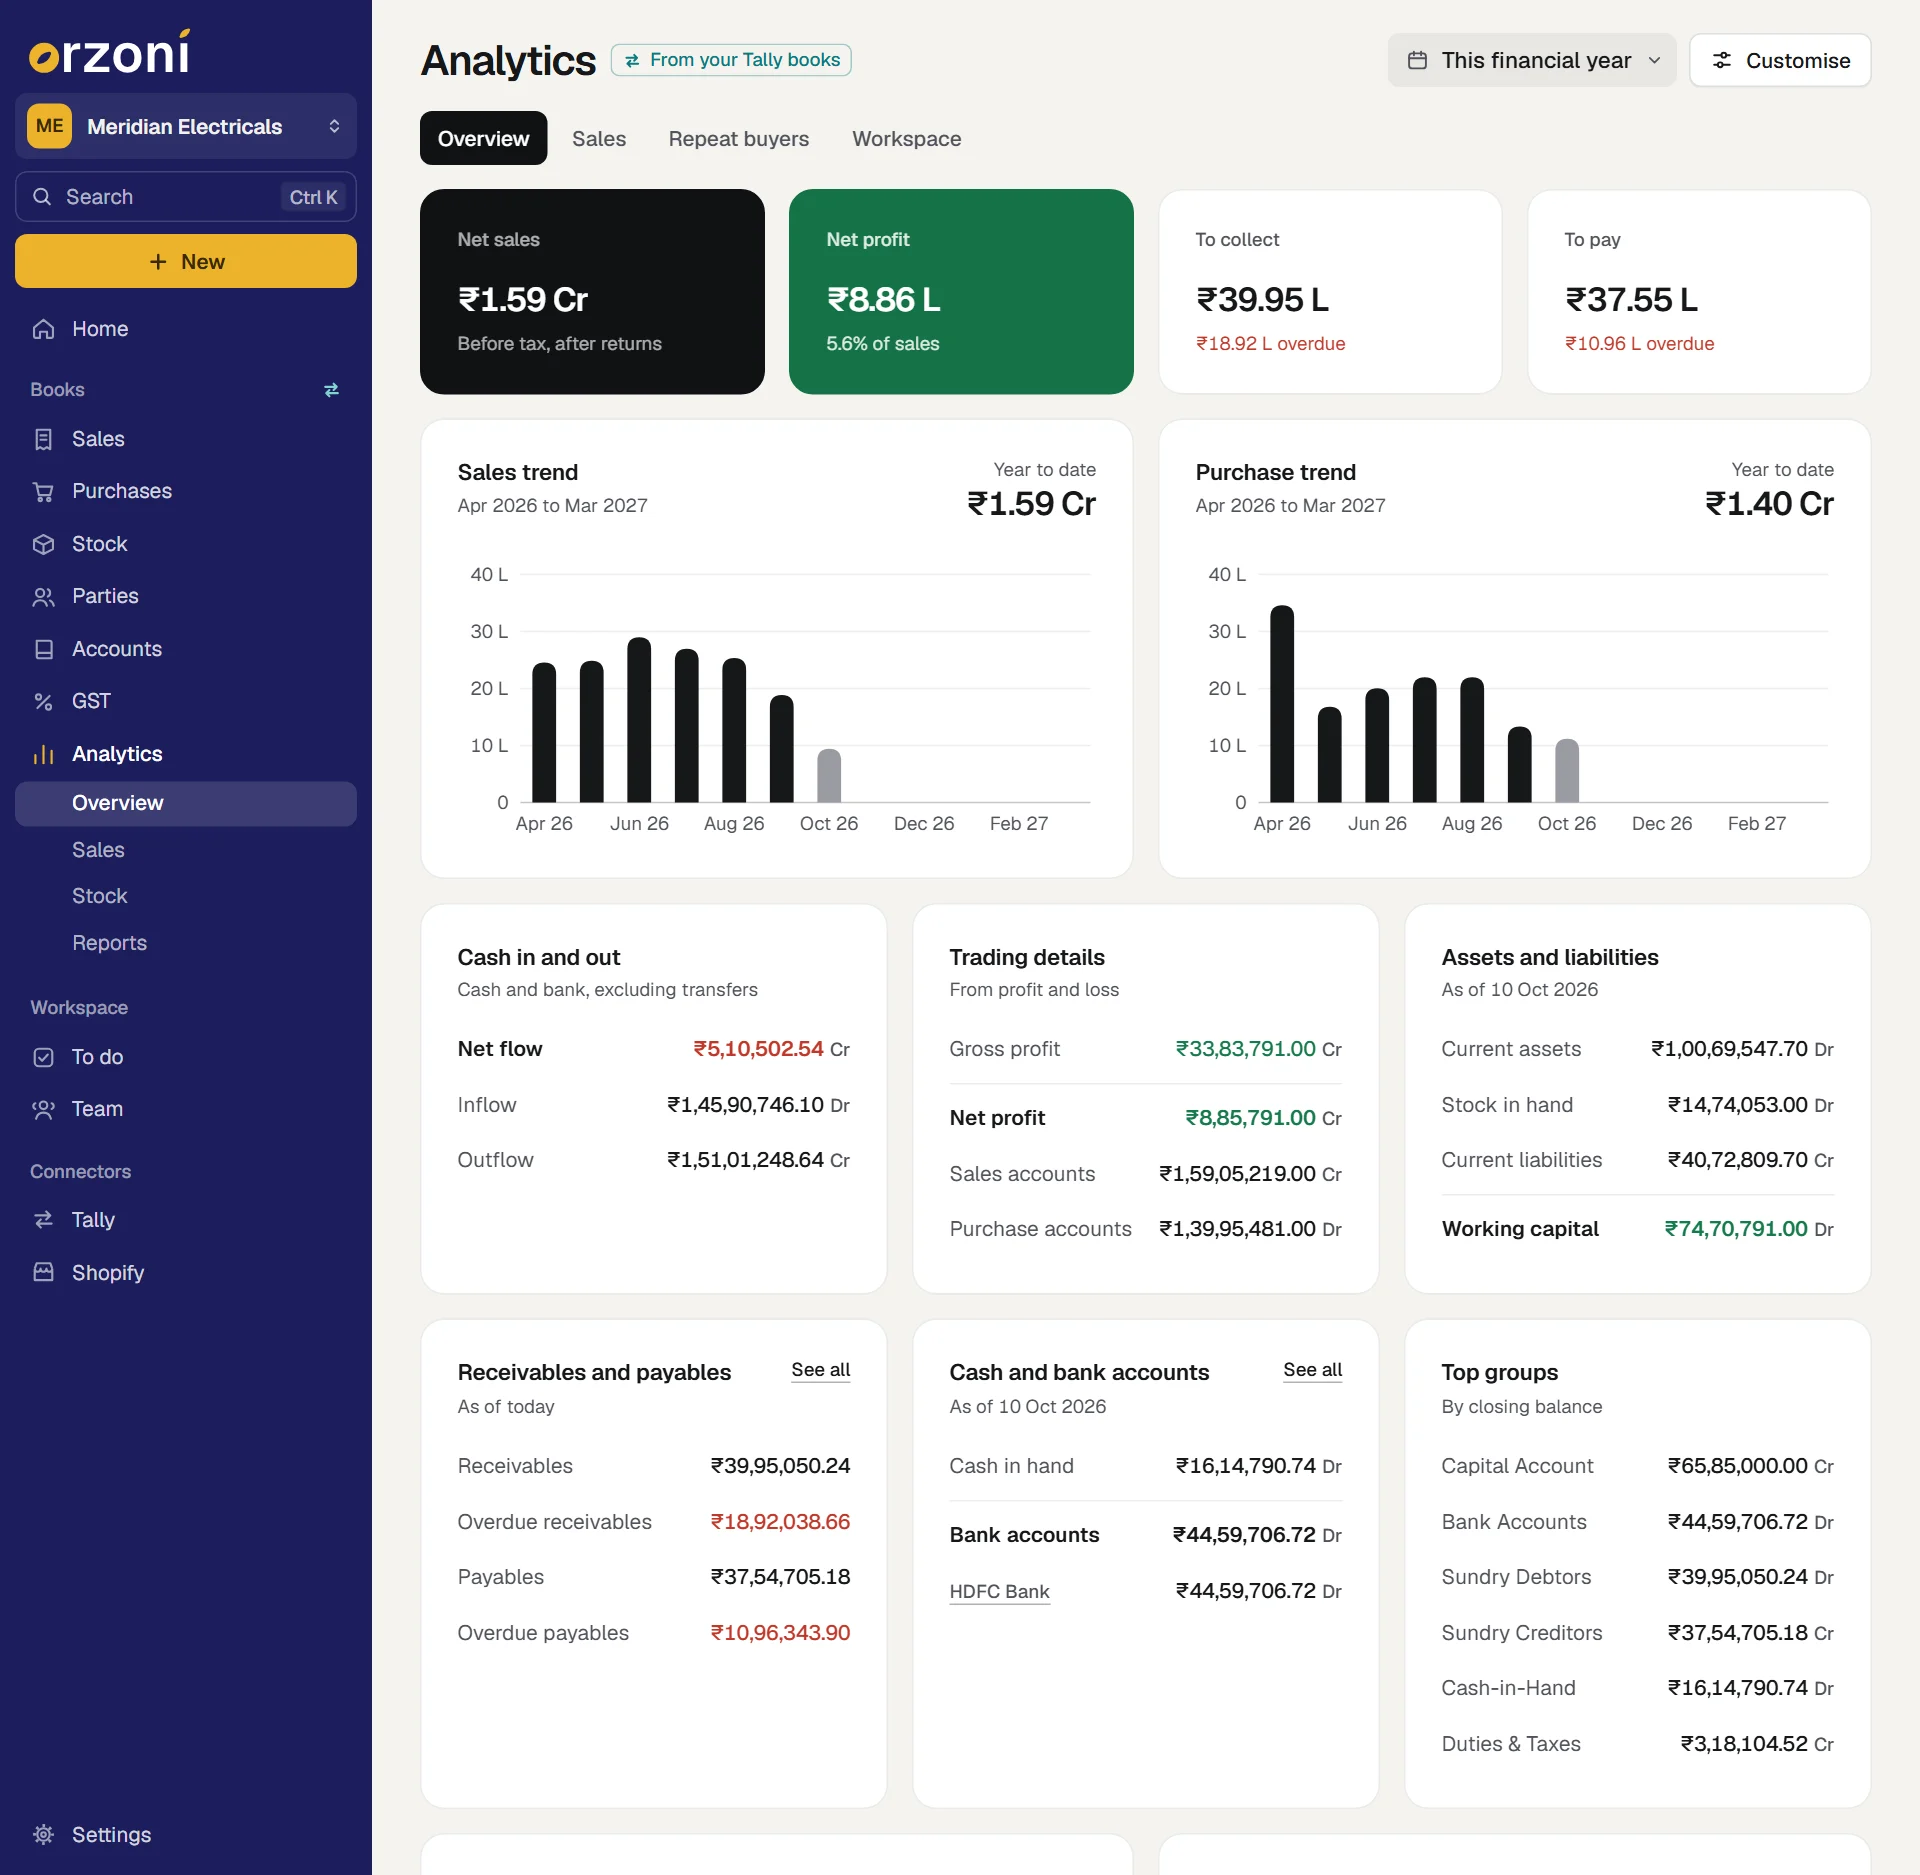
The first row is four figures.
| Tile | Shows |
|---|---|
| Net sales | Sales for the dates chosen, before tax and after returns. It stands on black because it leads the page |
| Net profit | Profit for the dates, and what share of sales it is. Green for a profit. It turns into a red tile named Net loss when the dates made a loss |
| To collect | What customers owe you today. Under it, how much is overdue, in red, or how many invoices are unpaid |
| To pay | What you owe suppliers today. Under it, how much is overdue, in red, or how many supplier bills are unpaid |
Under them are the tiles of Tally's own dashboard, each worked out the way Tally works the tile of the same name, so the two can be read side by side.
| Tile | Shows |
|---|---|
| Sales trend | A bar for each month of the financial year, and the total beside the name: Year to date while the year is running, Whole year for a year gone by |
| Purchase trend | The same, for purchases |
| Cash in and out | Net flow, Inflow and Outflow of cash and bank for the dates, leaving out transfers between your own accounts |
| Trading details | Gross profit, Net profit, Sales accounts and Purchase accounts, from the profit and loss of the dates |
| Assets and liabilities | Current assets, Stock in hand, Current liabilities and Working capital. Stock is on its own line and is not inside Current assets, as on Tally's dashboard. Working capital is current assets plus stock, less current liabilities |
| Receivables and payables | Receivables, Overdue receivables, Payables and Overdue payables, as of today. See all opens Cash and dues |
| Cash and bank accounts | Cash in hand, the total under Bank accounts, then up to five bank accounts, largest first. Press an account's name for its ledger. See all opens Ledgers |
| Top groups | Up to eight of the largest groups in your balance sheet, by closing balance. Debtors, creditors, cash and bank are listed apart, not lumped under one heading |
| Accounting ratios | Ten ratios for the dates chosen. The caption says how many days they cover |
| Inventory details | Closing stock, and the value of goods Inwards and Outwards in the dates. See all opens stock analysis |
Amounts on these tiles carry Dr or Cr, as Tally writes them.
How the ratios are worked out
| Ratio | Worked out as |
|---|---|
| Inventory turnover | Sales accounts for the dates, divided by closing stock |
| Debt to equity | Loans (Liability), set against Capital Account plus the net profit of the dates |
| Receivable days | Sundry Debtors, divided by one day's sales |
| Return on investment | Net profit, as a share of Capital Account plus that profit |
| Return on working capital | Net profit, as a share of working capital |
| Current ratio | Current assets plus stock, set against current liabilities |
| Quick ratio | Current assets without stock, set against current liabilities |
| Gross profit | Tally's gross profit, as a share of Sales accounts |
| Net profit | Net profit, as a share of Sales accounts |
| Operating cost | Sales accounts less net profit, as a share of Sales accounts |
A ratio your books cannot give reads Not known: there were no sales in the dates, say, or there is no capital to set a loan against.
Sales
| Tile | Shows |
|---|---|
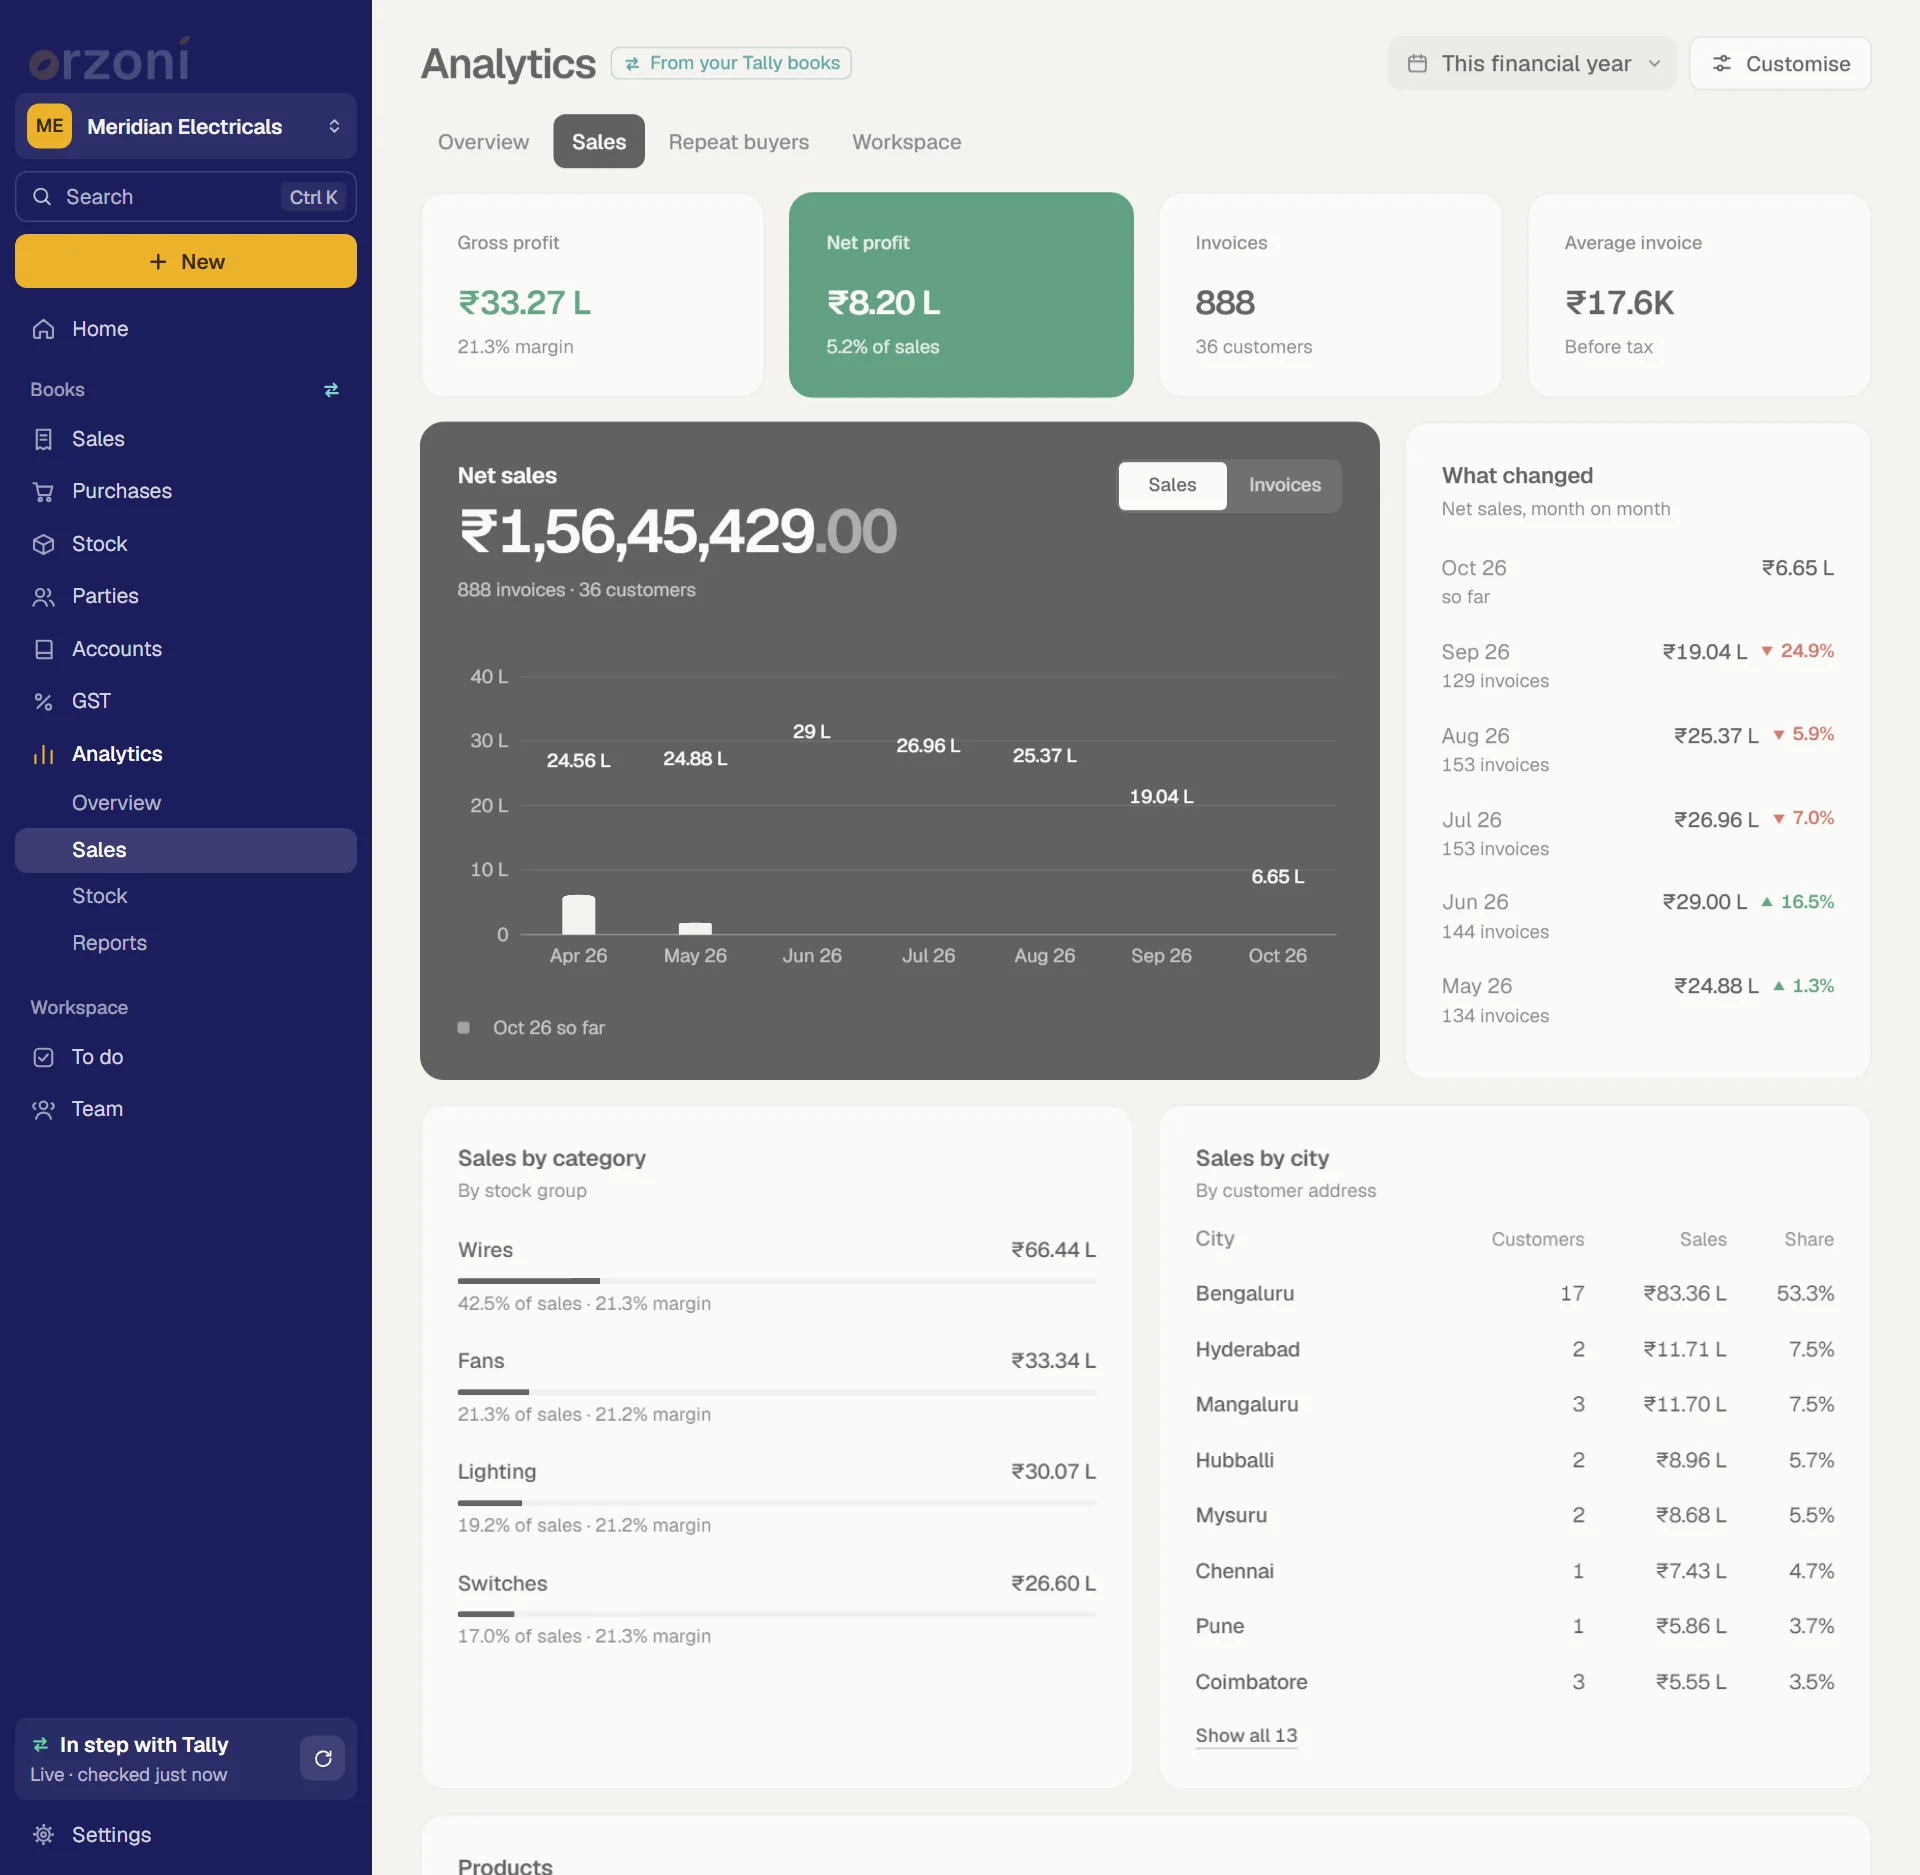
| Gross profit | Net sales less the cost of what was sold, and the margin it comes to |
| Net profit | The same tile as on Overview |
| Invoices | How many sales invoices, and to how many customers |
| Average invoice | Net sales divided by the number of invoices, before tax |
| Net sales | The figure to the paisa, a line setting it against the period before, and a chart of the dates chosen |
| What changed | The dates set against the period of the same length just before |
| Sales by category | Each stock group, with its share of sales and its margin |
| Sales by city | Each city, with its customers, its sales and its share |
| Products | Every product sold, with quantity, sales and margin at average cost |
| Where you sell | A map of the states you sell in |
The chart on Net sales
- Sales and Invoices, at the top right of the tile, switch what the bars count.
- The bars are days when the dates cover up to 31 days, weeks up to 120 days, and months beyond that. Past about three years they are years.
- When the dates run up to today, the last bar is paler and the line under the chart names it with "so far". It is still being added to.
- Point at a bar to see that bar's net sales and its number of invoices.
What changed
Six lines: Net sales, Gross profit, Net profit, Invoices, Average invoice and Expenses. Each has what it was in the period before, what it is now and the change. The biggest change is first, whichever way it went.
When the period before lies outside your books, there is nothing to compare with. The tile then reads net sales step by step: the last six days, weeks or months, newest first, each set against the one before it.
Categories, cities and products
- Sales by category goes by the stock group each item is under in Tally. Sales billed with no stock item are one line, No item on the bill.
- Sales by city comes from each customer's address in Tally. Customers with no city are under Unknown.
- A long list shows its first rows, with Show all under it. Show fewer folds it again.
- Press a product for its detail.
Where you sell
The map shades each state by how much you sold there. Beside it are the six leading States or Cities: the two buttons at the top right switch between them.
- Press a state on the map, or in the list, to pick it out. Press it again to let go.
- Point at a state for its sales, its share and its number of customers.
- Sales to customers with no state in Tally are said in a line under the list. Add the state to the customer's address and the map fills in.
- A cash sale names no customer, so it cannot be placed on the map.
Repeat buyers
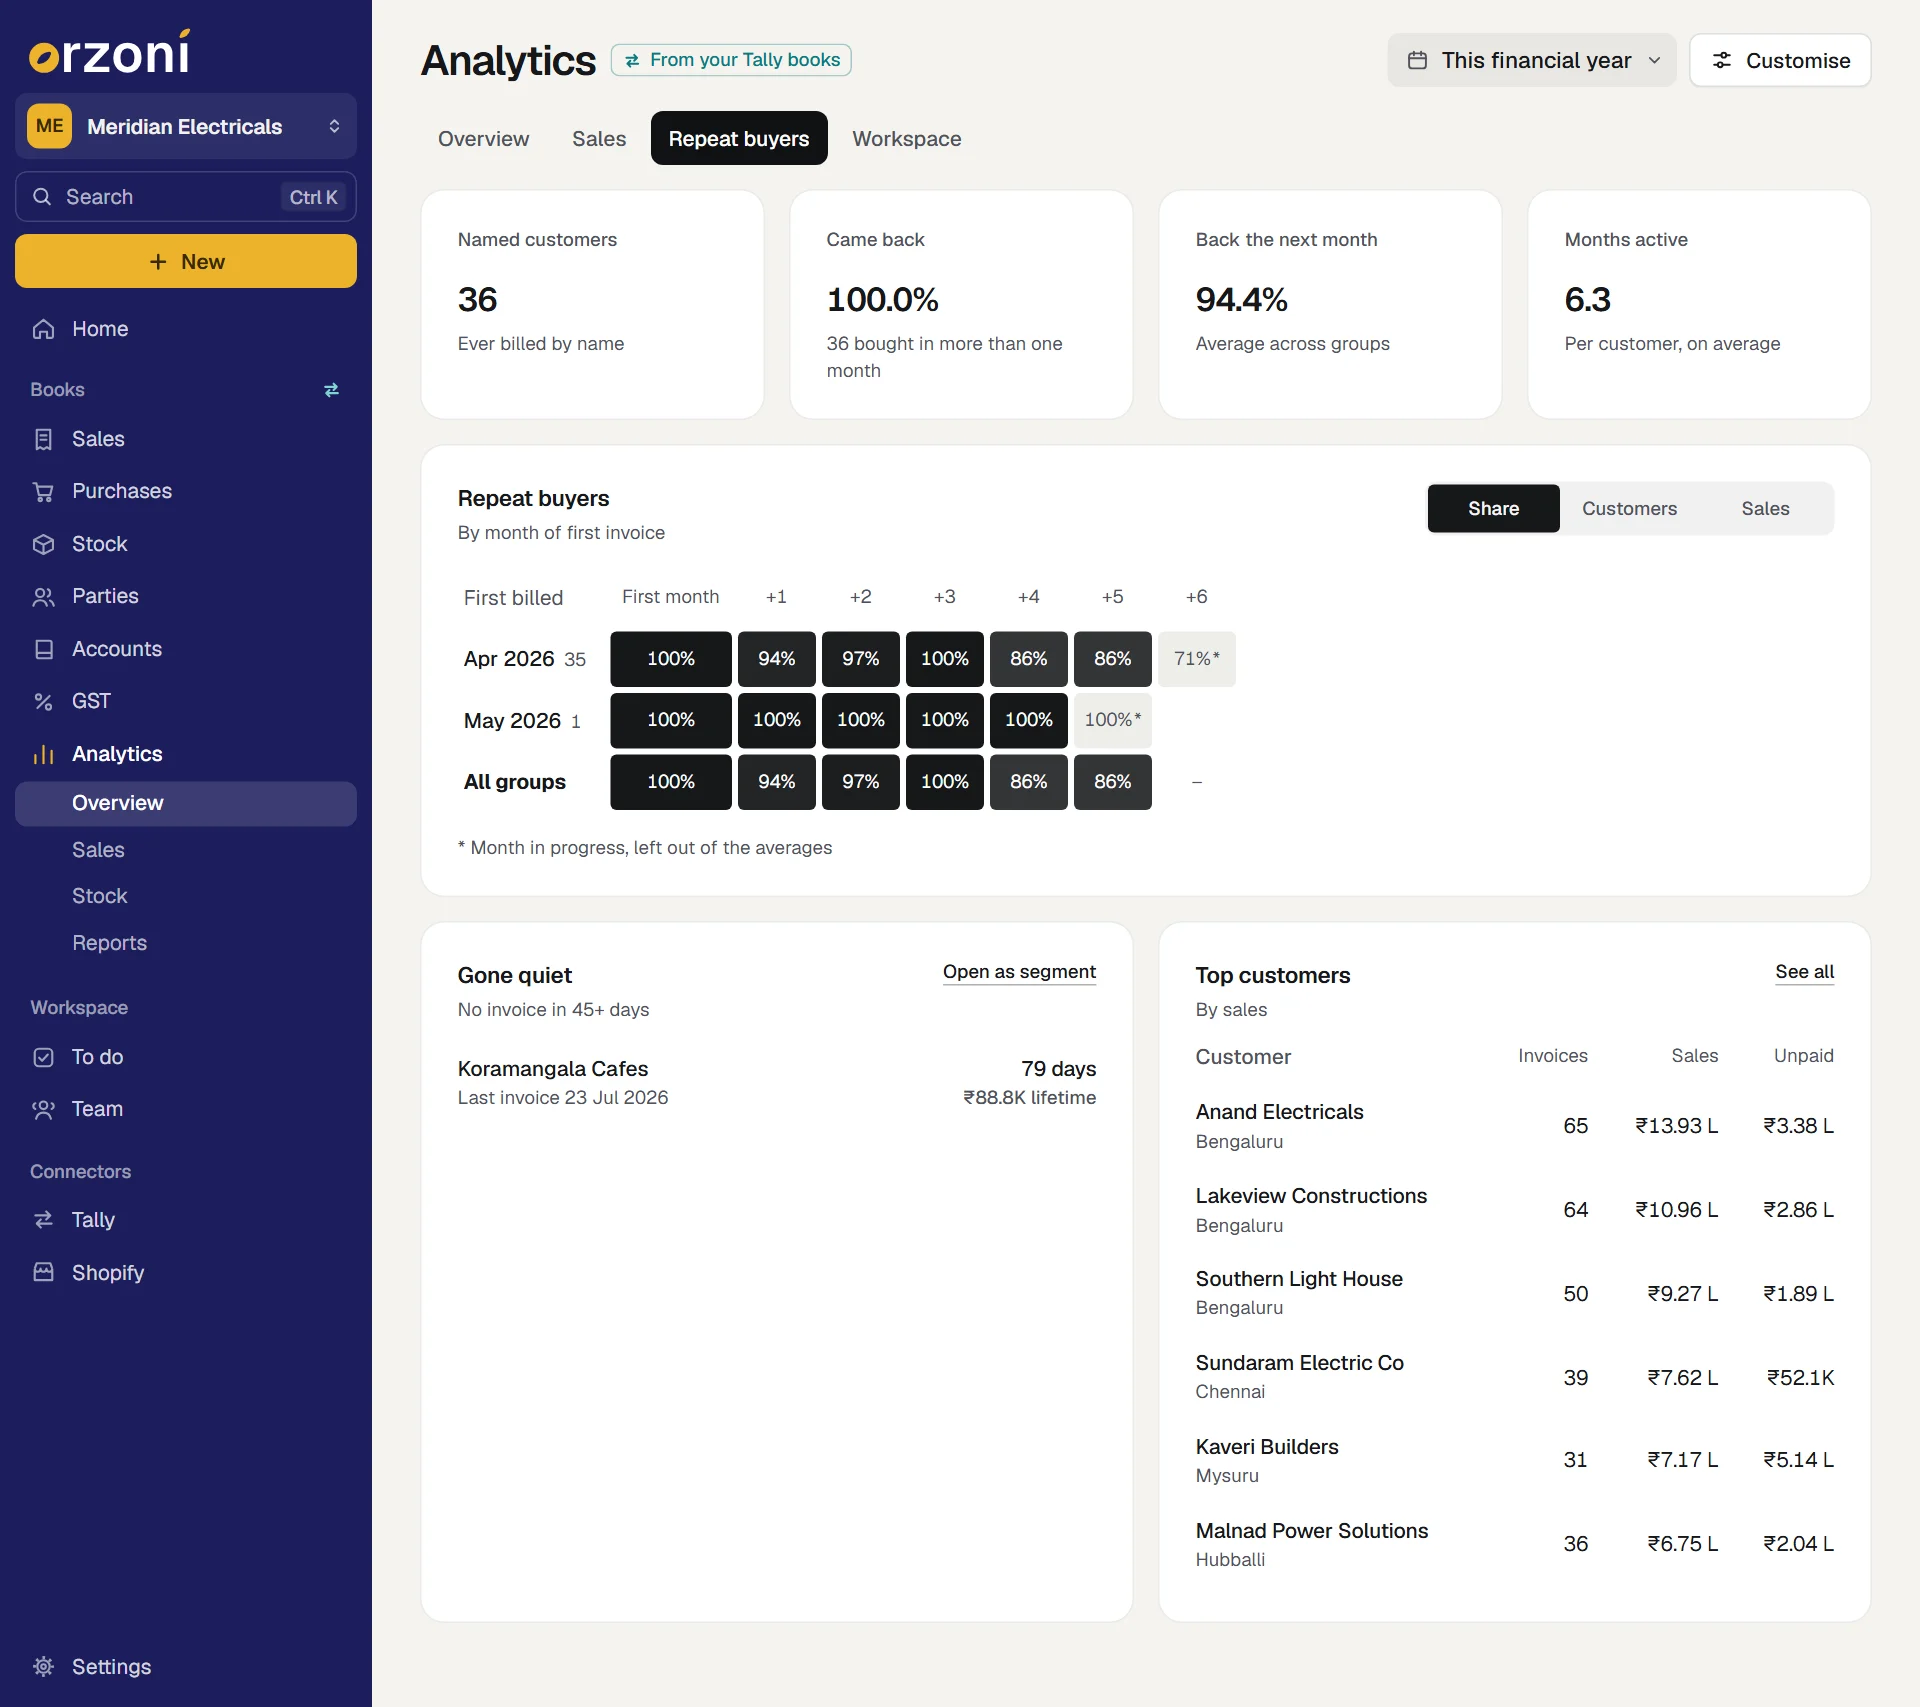
This page answers one question: of the customers you billed for the first time in a month, how many bought again, and when.
What counts
- Only named customers count. A named customer is whoever a sales invoice is made out to by name. A cash sale has nobody to come back, so it is left out.
- Customers are grouped by the month of their first invoice. Everyone first billed in April 2026 is one group, for good.
- A repeat buyer is a named customer invoiced in more than one month. Three invoices in the same month count as one month, not three.
- It reads the whole of your books, up to the last day read from Tally. The dates at the top of the page do not change it.
The four figures
| Tile | Shows |
|---|---|
| Named customers | How many customers have ever been billed by name |
| Came back | The share of them who were invoiced in more than one month. Under it, how many that is |
| Back the next month | The share who were invoiced again in the month straight after their first, across every group old enough to tell. It reads Too early until one group has a finished second month |
| Months active | The number of months with an invoice, for each customer on average |
Read the table
Each row is one group. The first column is the month they were first billed, with how many customers are in the group. First month is that month itself. +1 is the month after it, +2 the month after that, and so on up to the present.
Three buttons at the top right switch what each cell shows.
| Button | Each cell shows |
|---|---|
| Share | The share of the group who were invoiced in that month |
| Customers | How many of the group were invoiced in that month |
| Sales | What the group bought in that month, in all |
Take a row that reads Apr 2026, 35, then 100%, 94%, 97%. The group is the 35 customers first billed in April 2026. All of them bought in April, which is why First month is always 100%. In May, 94% of those 35 were invoiced again. In June, 97% of the same 35 were.
- A darker cell is a larger one. Under Share and Customers the shade follows the share. Under Sales it follows the amount, set against the largest cell in the table.
- A star marks a month still in progress. It is shown, and left out of the averages: a month with days to go is not a month the customer stayed away.
- All groups, the last row, is shown under Share. For each column it takes every group old enough to have a finished month that far on, and gives the share of all their customers who bought. A dash means no group is old enough yet.
- Point at a cell for the count behind it: how many of the group bought, and what they spent.
- Press a group's month to see who is in it. The first 14 names are listed. Press a name to open that customer.
Until a named customer has been billed, the table reads No named customers billed yet.
Gone quiet and top customers
- Gone quiet lists up to eight customers with no invoice for 45 days or more, the largest by lifetime sales first, each with the day of their last invoice. Open as segment opens the full list as a segment.
- Top customers lists the six customers with the most sales in the dates chosen, with their invoices and what each has unpaid. See all opens Customers. Unlike the rest of this page, this tile does follow the dates.
Workspace
Seven tiles from the To do and Team screens. Each reads the same answer its own screen is drawn from, and each leads to that screen.
| Tile | Shows |
|---|---|
| In today | How many are present or on a half day, out of those due in today. Under it, how many are away and how many are not marked yet |
| Open tasks | How many tasks are open. Under it, how many are overdue and how many fall due today |
| Promises to pay | Promises broken, with what those customers still owe. Failing that, promises due today, with what is expected. Failing that, the promises still to come |
| Pay this month | Pay for the month so far, and what is still to pay once someone has been paid |
| Attendance | A bar for each of the last 7 days: how many people were in. A half day counts as half |
| Tasks | The five open tasks that fall due next, with who each is given to |
| Follow up | The five customers most in need of a call. Press one to open their follow-up |
- These tiles are not for a span of dates. They show today, this week and this month whatever dates are chosen.
- A tile whose screen is not part of your role reads Not part of your access. See Users and roles.
- If your board was arranged before this page existed, it is not there by itself. Add it from the pages menu: see Pages below.
What the colours mean
Three colours carry the whole board, and two of them are verdicts.
- Green is said only of what is good: a profit, a change for the better.
- Red is said only of what is bad: a loss, what is overdue, what has run out, a change for the worse.
- Black is neutral. A tile on black leads its page, and is neither good nor bad. Bars are black too: purchases and money out are not coloured red.
The small arrow beside a figure compares it with the period of the same length just before. It is coloured by whether the change is good, not by which way it points: expenses going up show in red. In place of an arrow you may read New (there was nothing before), No change, 10× or more or Far lower.
The dates
The button at the top right names the dates on show. Press it, or press F2, to open the dates menu.
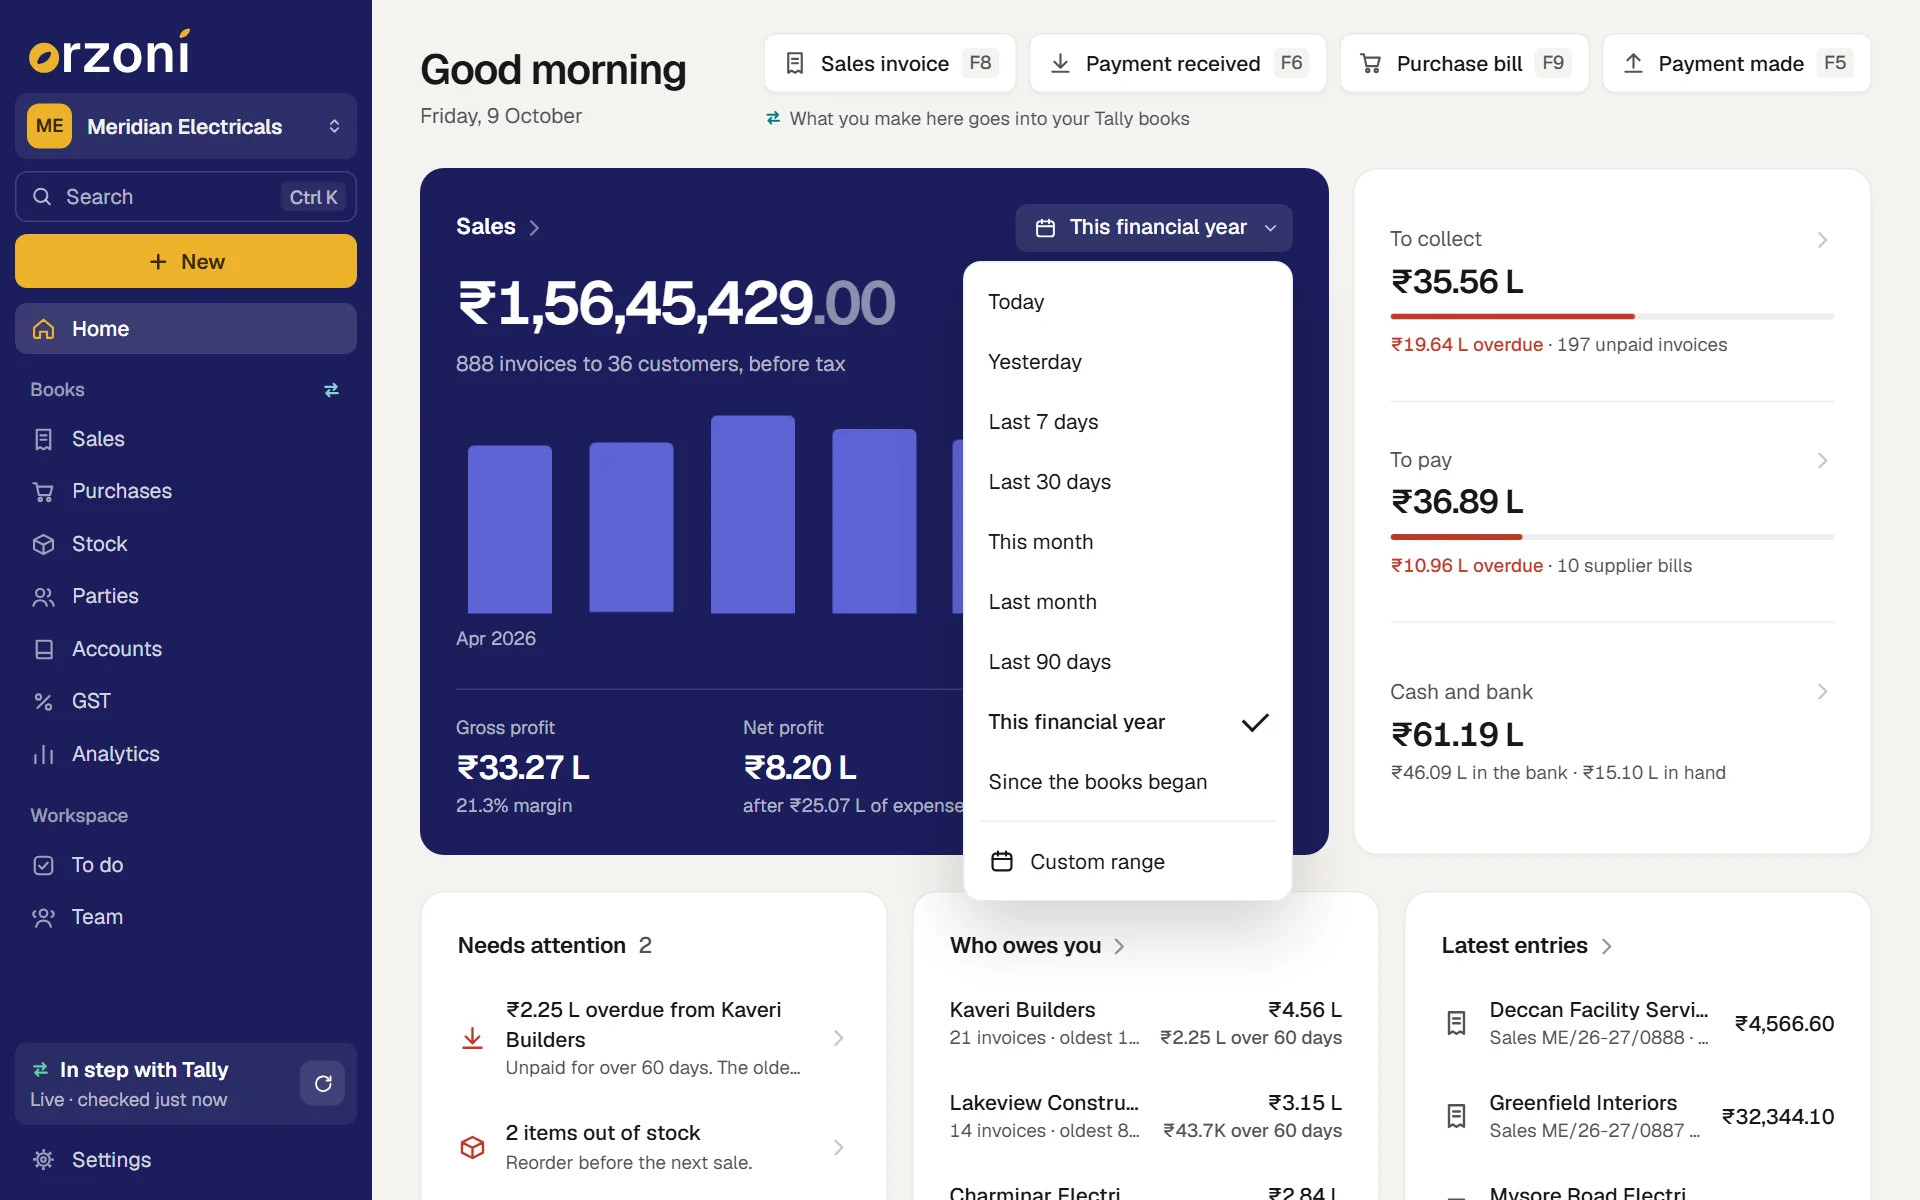
Choose Today, Yesterday, Last 7 days, Last 30 days, This month, Last month, Last 90 days, This financial year or Since the books began.
The tiles that depend on the dates are worked again. The rest stay as they are.
- For any other dates, choose Custom range. Two boxes open, From and To.
- Press a box for its calendar, or type the date the way you write it:
8-10-26,8/10or8 Oct. Press Show these dates.
If the first date is after the second, the menu says so and stays open.
The dates you choose stay chosen as you go from screen to screen. This financial year begins in the month your Tally books begin their year: April, unless Tally says otherwise.
What follows the dates, and what does not:
- Sales, profit, cash flow, trading details, ratios and stock movement are for the dates chosen.
- Assets and liabilities, Cash and bank accounts and Top groups are balances as of the last day chosen, or today when the dates run up to today. The caption on the tile gives the day.
- To collect, To pay and Receivables and payables are always as of today.
- Sales trend and Purchase trend always show the whole financial year the dates end in.
- Repeat buyers and Workspace are not for a span of dates.
- The arrows need an earlier period of the same length that lies wholly inside your books. With Since the books began there is none, so no arrow is shown.
When the dates hold nothing
When the dates hold no sales, the page says so in a card above the tiles: the day of your latest sale, how long ago that was, and buttons for a wider range that does hold it. Other dates opens the full menu. The tiles that would all read nought are left out until the dates hold something.
Arrange a page
Press Customise. On a phone, press and hold a tile. The tiles loosen, and a bar appears at the foot of the screen.
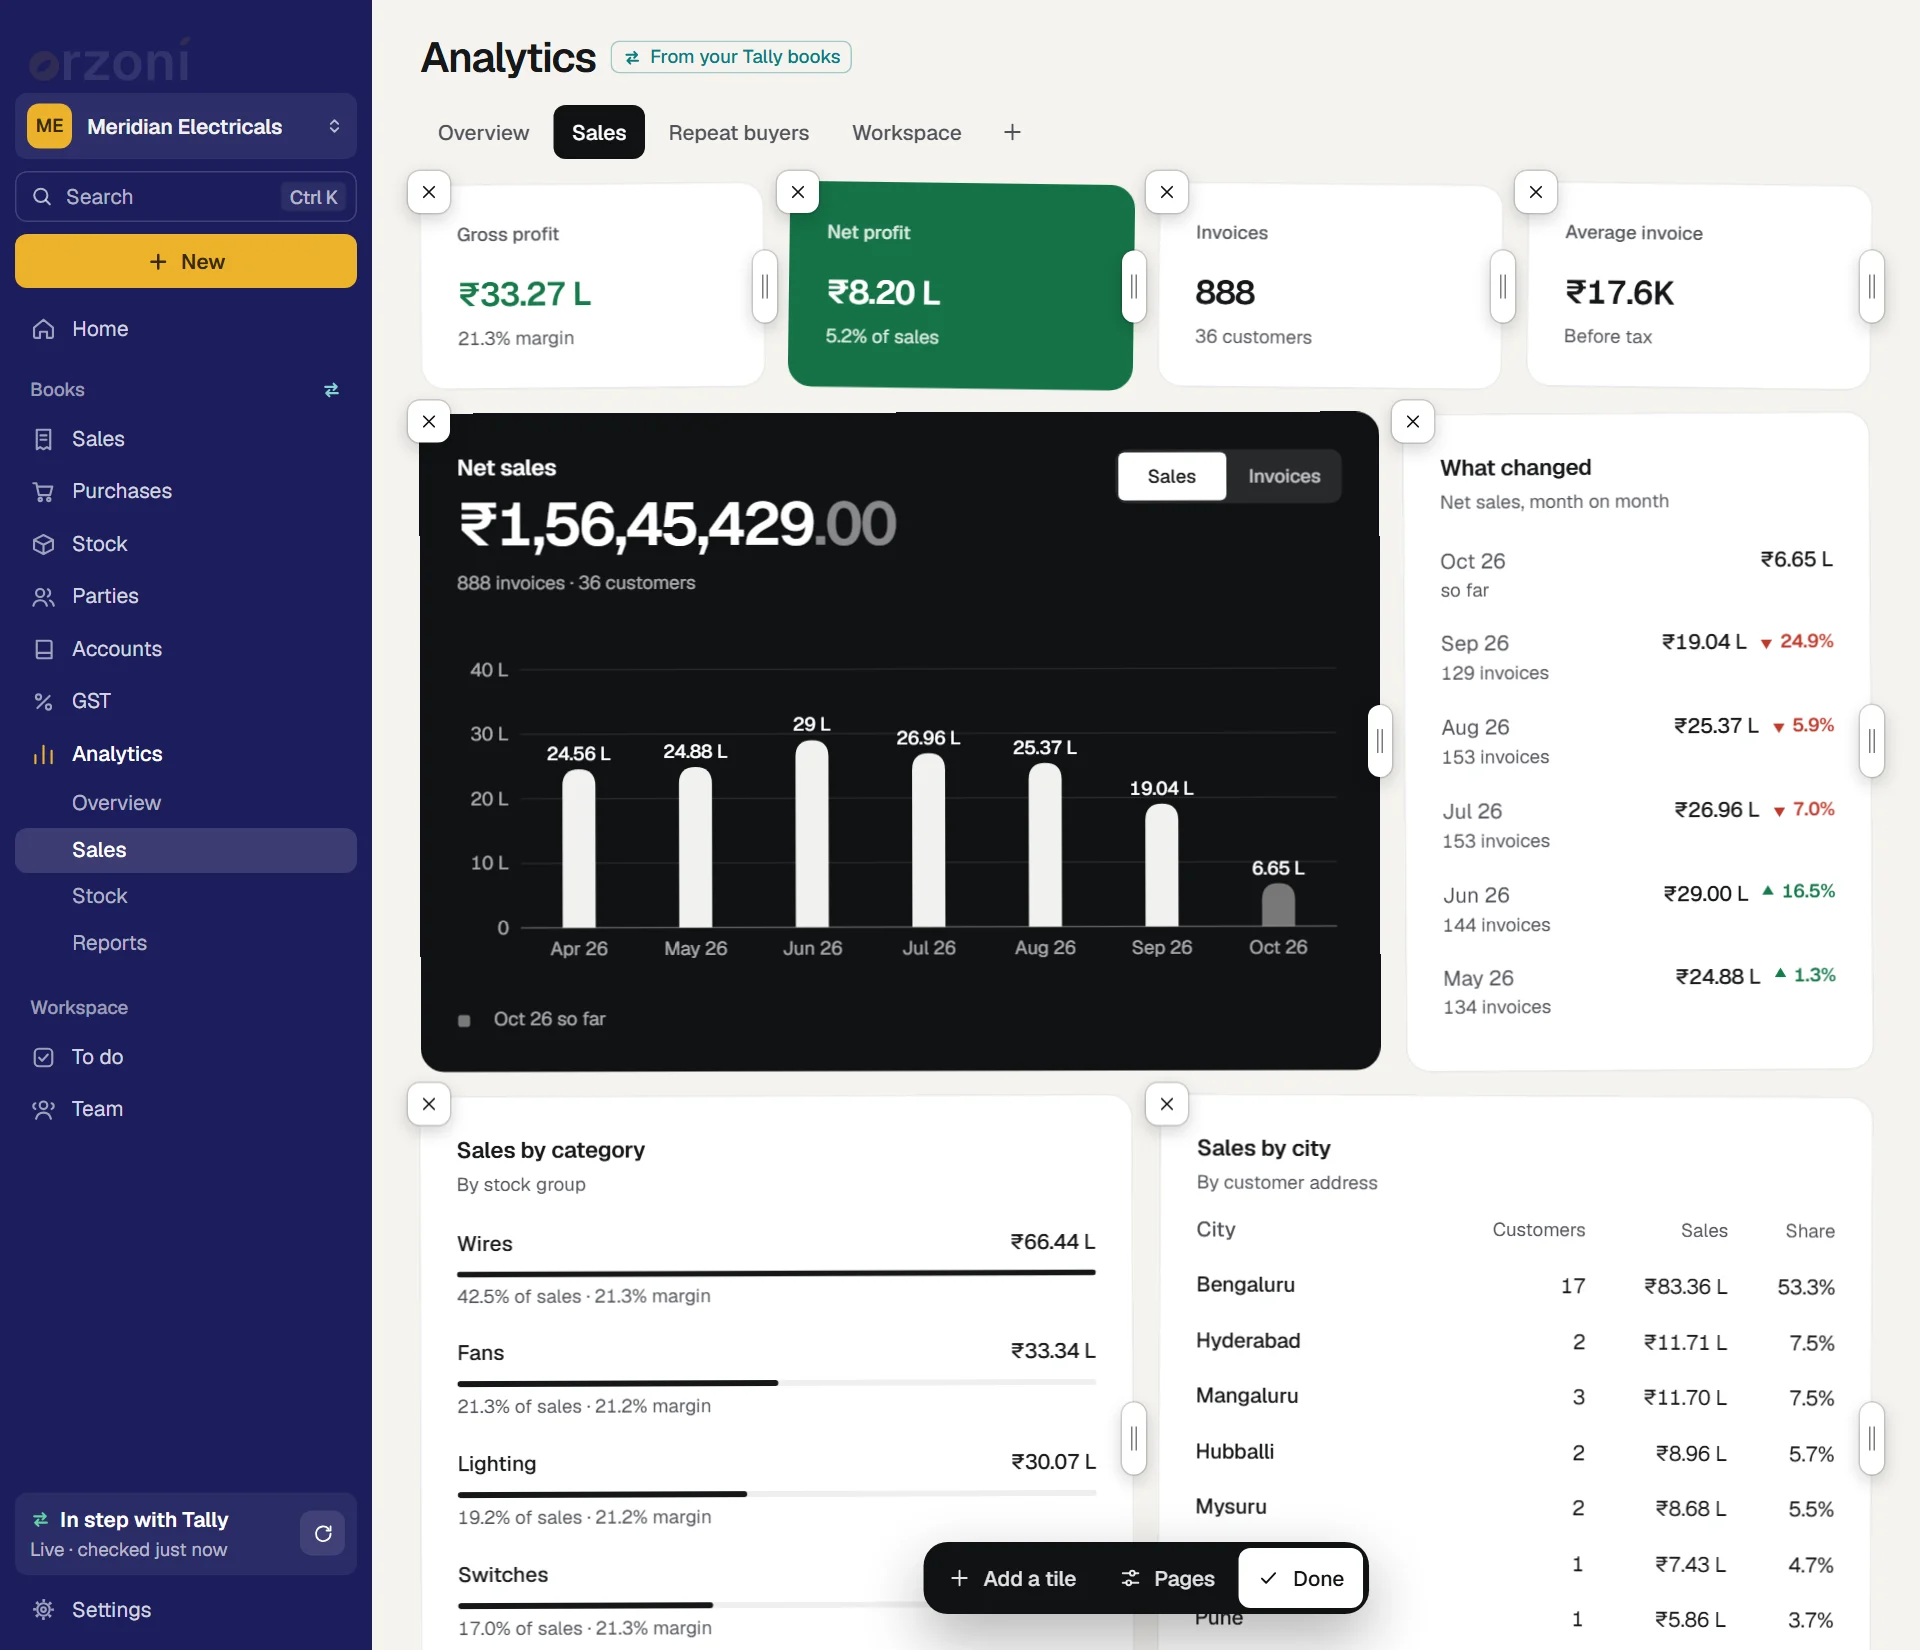
Move a tile by dragging it to its place. The others make room.
To take it to another page, hold it over that page's name for a moment, or drop it there. A page can hold a tile once: if it is there already, Orzoni says so and leaves it where it was.
Make it wider or narrower by dragging the grip at its right edge sideways. The width moves a step at a time and is named as you go: Quarter, Third, Half, Two thirds, Full width. Pressing the grip steps to the next width.
A single figure can be a quarter, a third or half of a row. A chart or a list starts at a third. The map and the repeat buyers table are two thirds or the full row. On a phone a chart or a list always fills the row, so it has no grip there.
- Remove a tile with the cross at its top left. It can be added again at any time.
- Add a tile opens the list of every tile not on the page, under Sales, Money, Bills, Customers, Overview, Stock, Repeat buyers and Workspace. Press one and it lands at the end of the page, ringed for a moment. Any tile can go on any page.
- Press Done. Every change is kept as you make it, so there is nothing to save.
With the keyboard, while arranging: Tab to a tile, then the arrow keys move it, Enter steps its width, Delete removes it and Esc ends. Esc while a tile is being dragged puts it back.
A page with no tiles reads This page is empty, with Arrange this page to begin.
Pages
Pages in the bar opens the pages menu. So does the plus beside the pages' names, which shows while you are arranging.
- Rename this page. Type the name, up to 24 characters, and press Enter. Esc leaves it as it was.
- Remove this page. Overview and Sales are always there: they can be emptied and rearranged, not removed.
- A blank page, which you name as it opens.
- Ready-made pages: Money, Inventory and Customers, and Workspace or Repeat buyers again if you removed them.
- Put every page back to the usual. This, and removing a page that has tiles on it, is asked once more in the bar first: Keep it leaves things as they are.
A board holds eight pages, and a page holds 40 tiles.
What the ready-made pages hold
| Page | Tiles |
|---|---|
| Money | Cash and bank, To collect, To pay, Expenses, Money in and out (cash and bank by month, with a table), Today's balances, Who owes the most, Suppliers to pay, Unpaid invoices by age (in four ages, the two oldest in red) and Expenses by head |
| Inventory | Stock value at average cost, Items, Out of stock (a red tile when anything has run out), Running low (under 15 days of stock), Items running low, Slow-moving stock (over 45 days of stock), All items and Stock value by category |
| Customers | Buying customers, First-time customers, Returning customers, Cash sales, Top customers, Customers gone quiet, Best customer and Who owes the most |
First-time and Returning read Not known when the dates begin where your books do: nobody can have bought before them.
More tiles to add
These are on no page until you add them.
| Tile | Shows |
|---|---|
| Profit, line by line | Sales, cost of goods sold, gross profit, other income, expenses and net profit, adding up |
| Gross margin | Gross profit as a share of net sales |
| Products sold | How many different stock items were sold in the dates |
| Best category | The stock group with the largest share of sales |
| Top products | The five products with the most sales |
| Latest entries | The six newest entries in your books |
| Worth a look | What may need you today: bills not in Tally yet, money unpaid for over 60 days, more owed to suppliers than you hold in cash and bank, items running out, slow-moving stock, customers gone quiet, and details missing in your Tally data |
| GST for the period | GST to pay, or GST credit, with what was charged and what was paid |
Details missing in your Tally data are put right under Connectors, Tally: see Data health.
Who sees Analytics
Analytics is for people whose role includes See figures and reports. To someone without it, the rail does not show Analytics at all. See Users and roles.
Download the figures
Tiles do not download. To take any of these figures into a spreadsheet, build a report: see Reports.
What next
- Reports: the same figures as a table you can group, filter, download and share.
- Reorder and stock analysis: what to buy, and what is not moving.
- Segments: lists of customers or items that fit a rule, such as everyone gone quiet.
- Cash and dues: who owes you and whom you owe, bill by bill.
- Tasks and follow-ups and Team: the screens behind the Workspace page.
Still stuck? Write to support@orzoni.com and say which step you are on, or book a walk-through call.